Upcoming analytics courses, free webinars and articles
December 2013 newsletter

Thanks for your interest in our newsletter, please forward it to colleagues that may benefit from it. Please join us for our upcoming webinar next Monday on common analytic issues and mistakes in Tableau 8.

Eileen and I are excited to share our new courses on Tableau, Microstrategy Analytics Desktop (a free alternative for visual analytics and dashboards), SAS programming and data exploration and visualization are all available for on-site instruction.

We are booking engagements with clients for on-site training and strategic consulting projects throughout Q1 and into Q2 of 2014, please let us know if we can help you in 2014!

Data Management and Visual Analytics with Tableau (2 days)
January 28th-29th, 2014—Chicago, Illinois
Everyone can benefit from learning a reliable, flexible and repeatable method to analyze real-world data. Combine this with a solid grounding in the flow and core features of Tableau to achieve great returns with this course. In just two days, you will complete multiple real-world case studies with Tableau paired with supporting data management capabilities of Microsoft Excel and Microsoft Access.

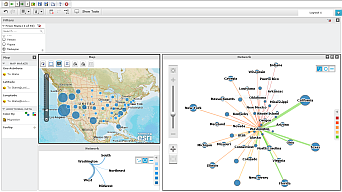
Data Management and Visual Analytics with Microstrategy Analytics Desktop (2 days)
Microstrategy Analytics Desktop is an exciting new offering of Microstrategy, an established leader in business intelligence. Available as a free product for both personal and professional use, Freakalytics considers this new product a good alternative to other leading products in visual analytics and analytic dashboards. It is capable of working with local data sources such as Excel, text files and Access databases in addition to remote, big data sources such as SQL Server, Oracle, MySQL and Hadoop.

Read more

Eight common analytic issues and mistakes in Tableau 8

Understand them, avoid them and correct them December 23rd, 2013 — 11 AM Central, Noon Eastern, 9 AM Pacific, 5 PM London Click here to register Synopsis In this webinar, Stephen reviews common shortcomings and misunderstandings that can prevent effective use of Tableau. These issues can result in misleading or just plain wrong answers being … Read more

Top News – Data, Data Warehousing, Analytics & BI

November 11th, 2013
Stephen McDaniel
Chief Data Officer Advisor at Freakalytics, LLC

i5_2Finding it hard to make time to keep up with the rapidly changing world of data, data warehousing, analytics, data science, business intelligence and visual analytics?  We understand! Here’s our curated summary of relevant news that could help with your future data and analytic projects. We also add commentary on the topic, a summary of the article and the link to read the full article.

There are seven articles in this update:
     How Big Data Is Changing Science (and Society)
     Big data blues: The dangers of data mining
     2014 INFORMS Conference on the Business of Big Data
     Facebook System for Massive Big Data (Hadoop FS) Offered Free to World
     Paxata Launches Industry’s First Adaptive Data Preparation Platform
     C-Suite and Trust Both Affect Financial Returns on Analytics, Big Data
     Meeting a VAST challenge – Lincoln Laboratory staff create winning visualization


i6How Big Data Is Changing Science (and Society)

Traditional statistical approaches that long dominated scientific research are being challenged and augmented by new approaches from the fields of big data and data science.

HOW CAN YOU PREDICT something without understanding it? Simple:

Read more

Tableau futures—seamless access to your data

From the 2013 Tableau Customer Conference!

Seamless Access to the Data—coming in Tableau 8.1 and 8.2

Nothing else matters if you can’t get your data into Tableau. This was a common refrain I have said for quite some time, Tableau is irrelevant if regular business people can’t figure out how to get the data into the product. In fact, it is a very frustrating experience.

Tableau states that cleaning, integrating and reshaping your data should be available as visual operations. You shouldn’t need to learn SQL to manage it.

A new data connection interface was demoed. Earlier this year, I contributed to the vision and feature debates for this area as part of a talented team of people at Tableau. This team included Jun K, Dan C, Jock M, Chris S, Richard and several other great people. Here’s an example flow:

1) You have some data about bike rentals.  It’s in Excel or a text file and looks like this.  A bit rough-column names in all caps, start_time is a text field and some other important data isn’t in this file.

1_Seamless_Access_Data_001


Read more

A brief history—Freakalytics and Tableau—since 2008

Stephen and I are frequently asked the story of why we wrote the first book endorsed by Tableau Software and how we launched their original, in-person training program back in 2009. In fact, we have been asked about this so many times, I decided it would be worthwhile to share the details.

2008
Stephen first discovered Tableau Software while working at Netflix. He was so impressed with the visual analytic capabilities of the product that after working with it for a couple of years, he approached the executives at Tableau about writing the first book on Tableau, which was still a tiny company at the time. They were excited about the idea so we met with CEO Christian Chabot, CDO and Co-founder Chris Stolte and several other executives to discuss the book content.

July 2009
Stephen completed and published the first edition of Rapid Graphs with Tableau Software just in time for the Tableau Customer Conference in Seattle. Marc Rueter, now a Senior Director at Tableau and Technical Reviewer of the book, wrote

“A great work- this is going to be a much-loved book.”

Read more

Free Tableau 8 e-book at the TCC Alteryx Pavilion!

RGTS 8 Book Cover Front 1500Visit the Alteryx Pavilion at Tableau Customer Conference 2013 in Washington, DC next week to learn more about the value of Strategy Analytics and Alteryx for Visual Analytics.  Notably, attendees can pick up a complimentary USB key with Visual Analytics Best Practices including work by Freakalytics and the key even includes a preview of Rapid Graphs with Tableau 8 and a coupon code for a free copy of the e-book! Note that you must redeem your code by September 18th, 2013.

This is the original guide to Tableau for The Accidental Analyst®.  Now in its fourth edition, this is the best-selling book on Tableau, trusted by thousands including many Tableau employees who learned Tableau from it- both before and after joining the company!  Back in 2009, Elissa Fink (CMO at Tableau) wrote about Rapid Graph with Tableau Software 5, “A must read for anyone interested in Tableau. Clear explanations, practical advice and beautiful examples!”  Just a few months ago, the Marketing team at Tableau ordered bulk copies of Rapid Graphs for their new customer acquisition program, reiterating their excitement over the four editions of this book!

Read more

Free Access to Rapid Graphs with Tableau 8–Chapter 6

Rapid Graphs with Tableau 8 The Original Guide for the Accidental Analyst We are pleased to provide free access to our book for all site members. It is also available as a printed book on Amazon. The home page for this release is here. Read Chapter 6 (pages 97-118)      Take over with Tableau—View structure,           Marks … Read more

Free Access to Rapid Graphs with Tableau 8–Chapter 5

Rapid Graphs with Tableau 8 The Original Guide for the Accidental Analyst We are pleased to provide free access to our book for all site members. It is also available as a printed book on Amazon. The home page for this release is here. Read Chapter 5 (pages 79-96)      Advanced view types in Tableau-79           Scatter … Read more

Free Access to Rapid Graphs with Tableau 8–Chapter 4

Rapid Graphs with Tableau 8 The Original Guide for the Accidental Analyst We are pleased to provide free access to our book for all site members. It is also available as a printed book on Amazon. The home page for this release is here. Read Chapter 4 (pages 59-78)      Core view types in Tableau-59           Tables—an … Read more

Tableau Online Total Cost of Ownership Calculator

Stack_Money_Flickr_artist_in_Doing_Nothing
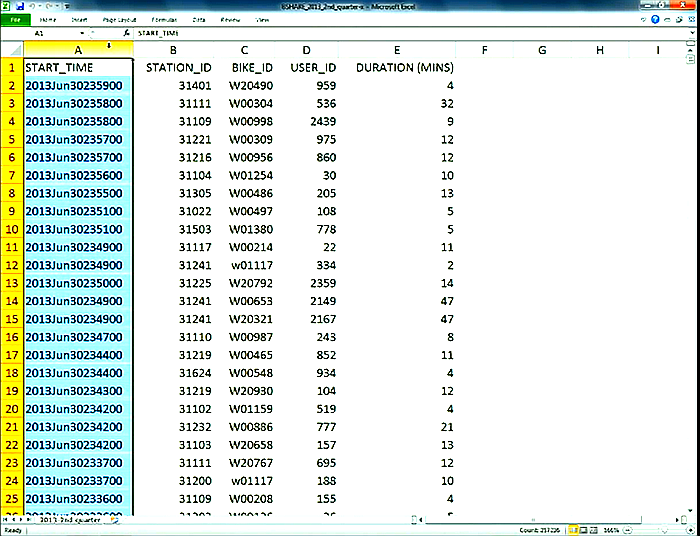
With our new cost of ownership calculator, you can estimate the number of Tableau Desktop, Tableau Desktop Pro, Tableau Online and Tableau Reader (free!) licenses to obtain for your specific needs. You can even calculate one-year and three-year estimates of cost to have Tableau at your organization, purchase consulting services and train your team.

To illustrate, the 3 Year Total Cost of Ownership, consulting and training inclusive, for a department of 30 is around $45,000. A larger deployment to a business unit with 500 people would total approximately $696,000. A 3 person company could get by for just $12,500. Start using our calculator now and make a smarter choice about your analytic investment!

Read more