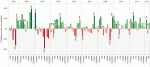
Quick reference for graph and dashboard design

Freakalytics has published a quick reference for building better graphs and dashboards. The Rapid Dashboards Reference Card has 64 tips readily available on four full-color, laminated pages. The card serves as a handy reference for yourself, your team and even your business audience during design meetings. Page 1 Excerpt, buy it at Amazon Page 3 … Read more

Bullet charts and simple enhancements to maximize value

Bullet charts were added to Tableau in version 5.1. They are an original idea designed and advocated for by Stephen Few, at the University of California at Berkeley. The bullet chart is intended to enable easy examination of attainment relative to a target for categorical items.
 
According to Stephen’s original specification, “The bullet graph was developed to replace the meters and gauges that are often used on dashboards. Its linear and no-frills design provides a rich display of data in a small space, which is essential on a dashboard.

I have shown the standard Tableau bullet chart and a wide array of variants in our public training course. Based on extensive attendee feedback, I will share how just a few minutes spent enriching your bullet charts will yield powerful enhancements for your dashboard audience.
 

Read more

A response to the TDWI article, “An Imperative to Build, Not Buy, Agile BI”

As TDWI and vendors catch on to the success of “Agile BI” being created with products like Tableau, I find the need to reply to the idea that the same old technology will work in this new world.   This article from TDWI energized me to write a response to this frequently cited idea.   In case you aren’t familiar with the acronmym “BI”, it simply means business intelligence, typically referring to traditional tools like Cognos, Business Objects, Excel, Microstrategy, SAS and many other products.  

What is Agile BI?  
“Agile BI” is new-found jargon that describes what

Read more

Stephen Few’s latest book, “Now you see it”

Stephen’s latest book is a brilliant interplay of simple to advanced statistical concepts with powerful visual equivalents and methods. It offers wonderful guidance with great examples around visualizing time series, correlations and multivariate analysis problems. It will have a major impact for many years to come in changing how business analysts work, think and improve … Read more