
Stephen McDaniel and Eileen McDaniel, Ph.D.
Freakalytics, LLC
Topics: Data Analysis, Visual Analytics and Business Intelligence
This was originally published in the
TDWI FlashPoint Newsletter in August of 2014
Italicized sections, images and their captions were not part of the TDWI version.
Until recently, visual analytics was considered a niche area. Those days are quickly passing; almost every major analytics and BI vendor is either launching or developing a product focused on visual analytics.
As a data professional, you’ll face challenges in integrating these products into your existing BI infrastructure. How can you successfully implement new visual analytics tools and keep your business customers engaged and happy? Step in front of the inevitable progression to visual analytics by crafting a winning data strategy.
We suggest starting in these three areas:
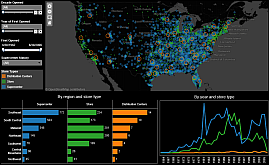
1. Learn the basics of the visual analytics tools used by the business analysts in your organization. Follow the process of how a real-world project is executed. Solving a typical business problem will give you a chance to experience firsthand what users are doing. You will be surprised at how the tools change your view of the data warehouse and “proper” data structures.
We’ve had many data professionals attend our analytics workshops. Even those with years of experience in the field tell us that managing code and databases is a completely different way of thinking about data compared to analyzing an issue, which has drastically different constraints and goals. Investigating a real problem that the business is facing should help you to see many possible ways that your data stores can be adjusted to enable successful analysis.
Check out our book on the principles of visual analytics, grounded in the scientific method, The Accidental Analyst. Stephen Few called it, “… a wonderful book, filled with practical advice.”
Tools to consider include Qlik Sense, SAP Lumira, Tibco Spotfire, Tableau and Microstrategy Analytics Desktop. We have successfully used all of these tools in our work with various clients. They all have differing strengths, workflows and design philosophies. Read more about these products and others in our Candid Quadrants report.
2. Find an ally in each of your key business areas, preferably one that is an expert analyst for a viewpoint from “the other side.” Leverage these analysts for invaluable knowledge to design better data structures in the form of tables, graphs, and system maps in your data systems. This is far more effective than decoding the whole process by yourself. When building data warehouses and downstream analytic data stores, we’ve discovered that expert analysts are often excited and motivated to collaborate on improving the efficiency and value of the data sources in their analyses.

Read more about collaborating with business and data teams in our previous TDWI article.
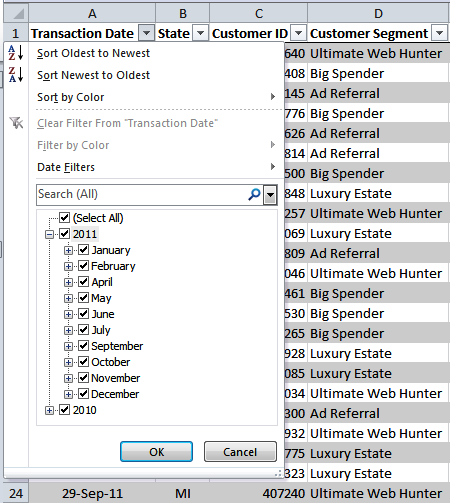
3. Commit to the reality that self-service data management with desktop spreadsheets and databases among business users is not going away. Instead, it will only continue to accelerate over the next few years. Part of this reality is driven by the fact that the appropriate data structure is often dependent on the analysis problem at hand. Another reason driving this growth is that more data streams are flowing into organizations, often at a rate that is overwhelming for analysts and data teams alike.
In our experience, when we help business users improve their data management skills, they are less likely to make mistakes or inaccurate assumptions about the data. They also better comprehend and appreciate the hard work involved in maintaining central systems.
Seize the opportunity to be more successful in your career as a data professional by understanding and incorporating the new landscape of BI and visual analytics into your data warehouse and collaborating closely with business users to establish a strong environment for analytics. Ultimately, data warehouses are about making better decisions in a timely manner, and these suggestions can help you further the utility of your data warehouse.
Learn more about Excel for business analytics in our free, recorded webinar.
Stephen McDaniel is an Chief Data Scientist at Freakalytics, LLC and author of several books on analytic software. Eileen McDaniel, PhD, is author of The Accidental Analyst and Director of Analytic Communications at Freakalytics. Both work with clients on strategic analytic projects, teach courses on analytics and are on the faculty at INFORMS.
Securely share R shiny apps
Develop R shiny apps
All on one dedicated, secure and powerful platform.