Recorded August 22nd, 2013
Do what you can with what you have where you are.
—THEODORE ROOSEVELT
Cowboy, soldier, historian and
26th President of the U.S.
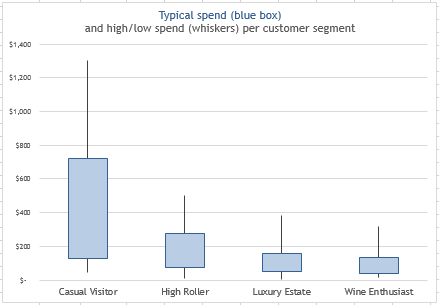
Synopsis
Answer everyday business questions like an analyst with Microsoft Excel. This webinar is based on a selected set of techniques from The 7C’s of Data Analysis, as covered in our book, The Accidental Analyst: Show Your Data Who’s Boss. An abbreviated case study will be used to demonstrate common techniques that can start you on the course to analyzing data with Microsoft Excel 2007, 2010 or 2013.
This presentation is approximately 1 hour and 15 minutes in length.
The webinar video
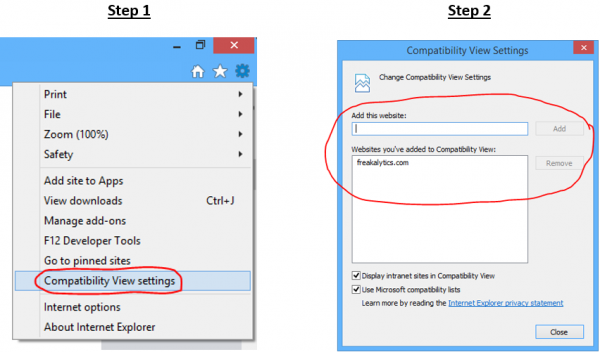
Internet Explorer requires compatibility mode to view the videos at Freakalytics. On newer versions of Internet Explorer, click the IE gear icon in the upper-right for menus, select Compatability View settings. A dialog appears where you should add freakalytics.com to your Websites you’ve added to Compatability View list.
On older versions of IE,
click the broken page icon at the far right of the address bar
![]()
Video Index
01:02 – The 7 C’s of Data Analysis
02:59 – The case study for this webinar
03:33 – The 1st C – Choose the question
06:10 – The 2nd C – Collect the data
08:19 – 2nd C – Collect and merge the data in
Excel – the power of VLookup
16:00 – Circle back and write down the 1st C
17:30 – The 3rd C – Check out the data
19:29 – 3rd C – investigate important data items
with pivot tables and pivot charts
32:44 – The 4th C – Clean up the data
33:26 – 4th C in Excel
42:14 – The 5th C – Chart your analysis
42:56 – 5th C in Excel – make a highlight table
51:22 – 5th C – adjust highlight table
for color blindness (particularly red/green)
54:36 – 5th C in Excel – make a line chart
59:07 – 5th C – findings from the highlight table
59:22 – 5th C – findings from the line chart
60:05 – The 6th C – Customize your analysis
62:09 – 6th C in Excel – calculated data items
and slicers in pivot charts
71:07 – The 7th C – Communicate results
71:25 – 7th C – compile key findings in
PowerPoint slide deck
76:32 – More resources for visual analytics
The presentation from this webinar
Use the controls to navigate. On touch-screens, you can swipe to navigate. Click on the slide to advance, click the four squares in the controls for the thumbnails to appear and click the four-way arrows for full-screen viewing. While in full-screen viewing mode, you can use the right/left arrow keys to advance/go back or simply swipe right and left on touch-screens. Use the ESC key or x in bottom control-bar to exit full-screen mode.
[portfolio_slideshow include=”10284,10285,10286,10287,10288,10289,10290,10291,10292,10293,10294,10295,10296,10297,10298,10299,10300,10301,10302,10303,10304,10305,10306,10307,10308,10309″]Enjoyed this? Please subscribe to our newsletter and share it!
We are a two-person, independent analytics company. Creating great content takes an enormous amount of time! You can support us by subscribing below and sharing this webinar with friends and colleagues. Thanks!
Subscribe to our newsletter
We promise to:
– Send exclusive content quarterly,
– Never share your info,
– Offer a simple way to unsubscribe
The webinar is past. Watch the recording and view the slides above.
Your attendance is complimentary thanks to sponsorship by The Accidental Analyst. Attendees with a US shipping address can optionally order a discounted copy of The Accidental Analyst with your ticket (shipping inclusive). Please allow two weeks after the webinar for the book to arrive.
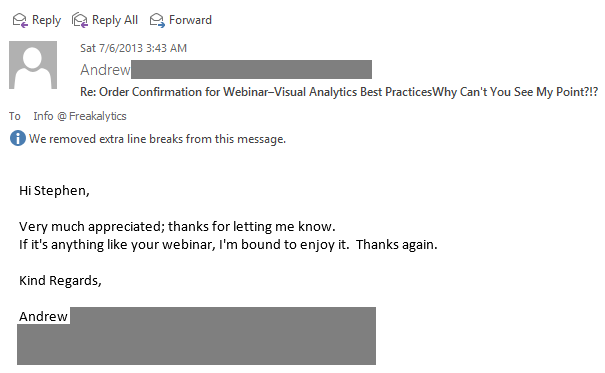
A recent webinar attendee, inquiring about their book order timing, wrote:
Securely share R shiny apps
Develop R shiny apps
All on one dedicated, secure and powerful platform.