The 8 version of this book is published in grayscale in order to meet popular demand for a lower list price versus earlier versions (5, 6 and 7) of this book series.
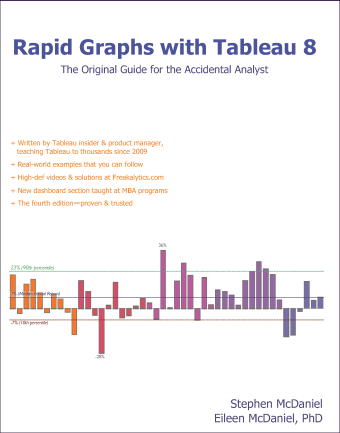 + Written by Tableau insider
& product manager, teaching
Tableau to thousands since 2009
+ Real-world examples that you
can follow include tips
and tricks to save you time
+ High-def videos & solutions
+ The fourth edition—proven & trusted


Summary of the book preview presentation above
Analyzing your data for success at work
Quickly answer your business questions and communicate your results
Tableau Software
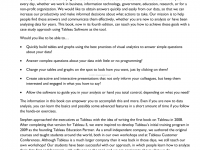
Would you like to be able to…
- Quickly build tables and graphs using the best practices of visual analytics to answer simple questions about your data?
- Answer complex questions about your data with little or no programming?
- Change your tables and graphs on the spot to look how you want, just by clicking on them?
- Create attractive and interactive presentations that not only inform your colleagues, but keep them interested and engaged in what you have to say?
- Allow the software to guide you in your analysis or hand you total control, depending on what you need?
We started work on the first book on Tableau back in 2008
Stephen McDaniel
Eileen McDaniel, PhD
Power
Graph your data using visual analytic best practices
Every major data source
Excel workbooks
Large databases
Offline analysis
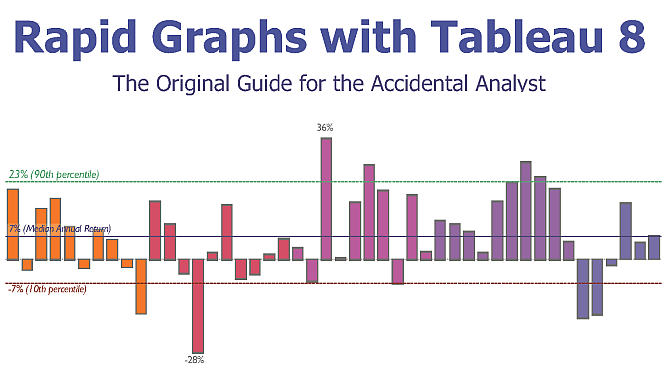
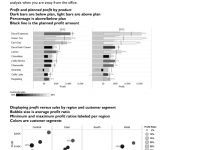
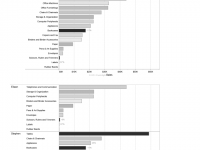
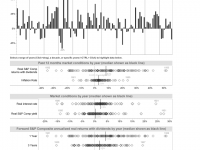
Profit and planned profit by product
Dark bars are below plan, light bars are above plan
Percentage is above/below plan
Black line is the planned profit amount
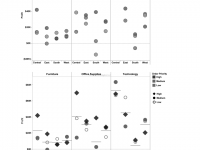
Displaying profit versus sales by region and customer segment
Bubble size is average profit ratio
Minimum and maximum profit ratios labeled per region
Colors are customer segments
Exploring the relationship of profit to sales by region
Each point in the graph is a customer order
Colors are customer segments
A trend line is displayed for each customer segment per region
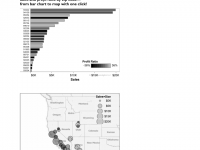
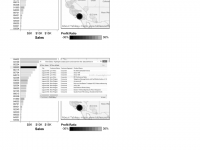
Map of per-capita income growth, 2006 to 2008
Color and size of bubble are growth rates (the darker and larger, the better)
Labeled states have the highest and lowest growth rates
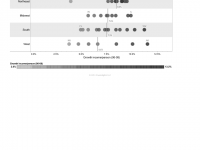
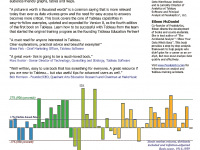
Scatter plot of per-capita income growth by region, 2006 to 2008
Colors are income growth (the darker the better)
Reference lines are median values for each region
Labeled states are top and bottom for the region
Speed
Build presentation quality graphs and tables
Rapidly sort, filter and group the displayed data–with just a few clicks of your mouse
Sales and profit ratio by zip code–
from bar chart to map with one click!
Highlight a data point to quickly examine the values behind it
From detailed table to color-highlighted table to side-by-side bar chart to color-encoded bar chart
Flexibility
Easily change any part of your view to look exactly how you want
Grouping the data with just a few clicks, from the view
Color and shape encode view elements for effective communication
Simplicity
Follow the hands-on exercises in this book
Learn the basics and begin mastering the techniques of graphical data exploration
Soon you will discover how to create visualizations that are more complex.
Areas of simplicity in Tableau
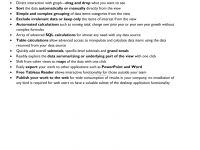
- Direct interaction with graph–drag and drop what you want to see
- Sort the data automatically or manually directly from the view
- Simple and complex grouping of data items categories from the view
- Exclude irrelevant data or keep only the items of interest from the view
- Automated calculations such as running total, change over prior year or year over year growth without complex formulas
- Array of advanced SQL calculations for almost any need with any data source
- Table calculations allow advanced access to manipulate and calculate data items using the data returned from your data source
- Quickly add overall subtotals, specific-level subtotals and grand totals
- Readily explore the data summarizing or underlying part of the view with one click
- Shift from other views to maps of the data with one click
- Easily export your work to other applications such as PowerPoint and Word
- Free Tableau Reader allows interactive functionality for those outside your team
- Publish your work to the web for wide consumption of results in your company; no installation of any kind is required for web users to have a valuable subset of the desktop application functionality
Beauty
Create your own works of art while telling the story of your data! Keep your audience engaged and informed during presentations. Impress others with effective, clear communications that lead to lively discussions and actionable results. The interactive version of our dashboard shown on the facing page is available at http://www.Freakalytics.com/p/4 and is included as a sample with the standard installs of both Tableau Desktop and Tableau Server.
Back cover and purchase link
Tired of boring spreadsheets and data overload from confusing graphs? Master the art of rapid graphs with Tableau! Our hands-on case study approach and more than 225 illustrations teach you how to quickly explore and understand your data to make informed decisions in a wide variety of real-world situations. We include best practices of visual analytics for ideas on how to communicate your findings with audience-friendly graphs, tables and maps.
“A picture is worth a thousand words” is a common saying that is more relevant today than ever as data volumes grow and the need for easy access to answers becomes more critical. This book covers the core of Tableau capabilities in easy-to-follow examples, updated and expanded for Version 8, as the fourth edition of the first book on Tableau. Learn how to be successful with Tableau from the team that started the original training program as the founding Tableau Education Partner!
“A must read for anyone interested in Tableau. Clear explanations, practical advice and beautiful examples!”
Elissa Fink – Chief Marketing Officer, Tableau Software
“A great work- this is going to be a much-loved book.”
Marc Rueter – Senior Director of Technology, Consulting and Strategy, Tableau Software
“Well written, easy to use book that has something for everyone.
A great resource if you are new to Tableau… but also useful tips for advanced users as well.”
Bob Morrison – Founder/CEO, Quadrant Arts Education Research and Chairman at MakeMusic
+ Buy it on Amazon

Securely share R shiny apps
Develop R shiny apps
All on one dedicated, secure and powerful platform.