 A few observations from this example
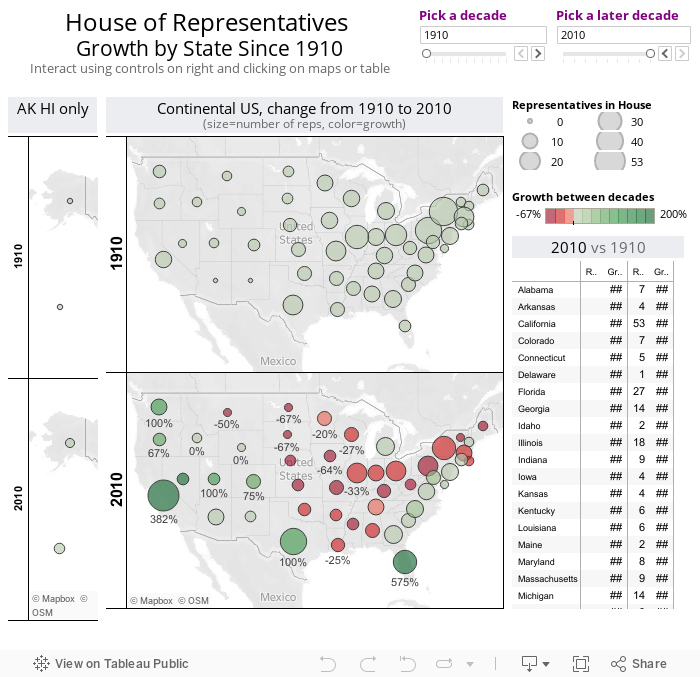
Examining this dashboard with the initial decades of 1960 and 2010, you can see that the control of the House has shifted toward the West and the South. Exceptions include Louisiana, Mississippi and Oklahoma in the South and Montana in the West.
If you adjust the first decade slider to 1910, an even more dramatic pattern appears! People love the sunshine and the West coast with California, Florida and Nevada growth at 300%+ and Washington, Oregon, Utah and Colorado at 67% or more growth.
Dashboard topics in this example
Download the workbook to peek at a few cool features of this dashboard, including:
1) Using table calculations to show growth across time in a map
2) Using parameters to pick two different decades, these parameters are used in a calculated field that is then added to the filter shelf
3) Tooltips for the maps are based on table calculations that dynamically display surrounding text when a value is available
4) Separating the Alaska and Hawaii map from the Continental US map to improve data review ability.
Freakalytics is the exclusive source of the original
Complete Tableau Training (4 days) and our new course,
Data Management and Visual Analytics with Tableau (2-days).
For a detailed review of Tableau features, pricing and capabilities, visit PowerTrip Analytics.
For the Tableau Online pricing calculator, click here.
Securely share R shiny apps
Develop R shiny apps
All on one dedicated, secure and powerful platform.